[Go back] | Publications Center | DOGAMI Home
DOGAMI Open File Reports O-10-12, O-10-13, O-10-14, O-10-15, O-10-16, O-10-17, and O-10-18, FEMA Flood Zone Change Maps, Coos County, Oregon, by Mathew A. Tilman.
See links below to download reports.
FEMA (the Federal Emergency Management Agency) produces maps that show areas that have a 1 in 100 chance of being flooded in any year (the 100-year flood). These maps are made by using the historical record of flood height and frequency, a hydrologic computer model, and the best available topographic data. The resulting maps, called DFIRMs (Digital Flood Insurance Rate Maps), are used to determine which properties need flood insurance.
In Coos County, the Oregon Department of Geology and Mineral Industries has updated the DFIRMs by using new, extremely accurate topographic data collected with a laser scanning system called lidar. The new DFIRMs much more accurately show flood zone boundaries and also allow us to measure flood depth at any point. At the same time, the lidar data allow us to locate every building in a community and make a GIS (geographic information systems) map that shows the exact location, elevation, zoning class, and assessed value of each building collected from tax assessor records. Together, these new types of information can provide a very detailed map that shows the general level of flood risk exposure for each building in a community.
This information can be used by city officials, emergency managers, property owners, lenders, and insurers to better understand flood risk and reduce the risk from future floods.
UNDERSTANDING THE MAPS
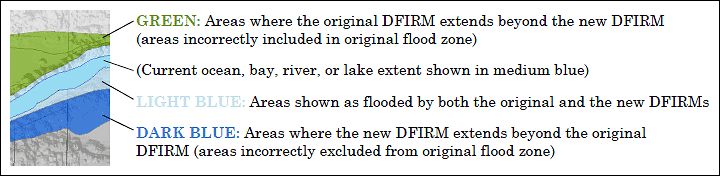
The maps show areas expected to be flooded during a 100-year flood and highlight the differences between the new, more accurate DFIRMs and the older DFIRMs. The expected extent of flooding is shown by one of three colors.
| Publication | Title | Scale |
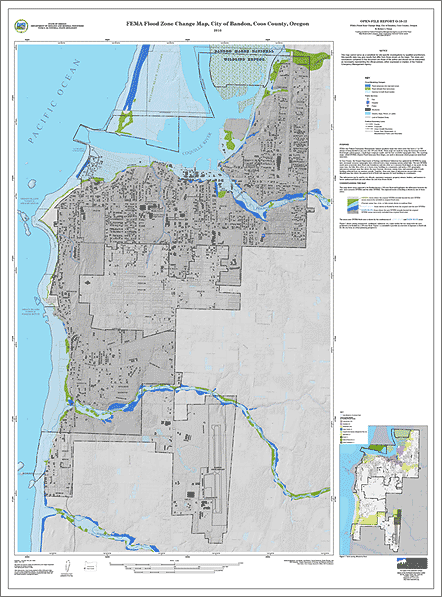
| Open-File Report O-10-12 (7 MB) | FEMA Flood Zone Change Map, City of Bandon, Coos County, Oregon | 1:6,000 |
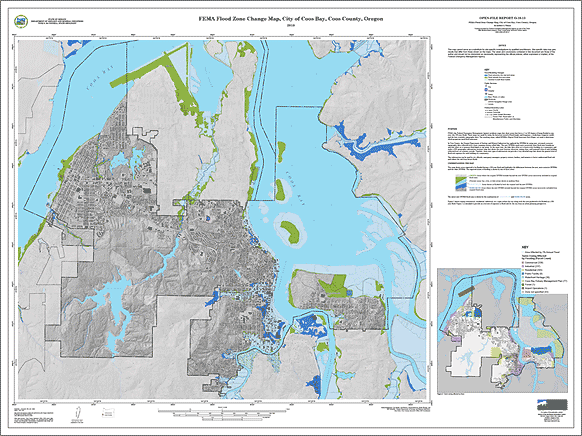
| Open-File Report O-10-13 (10 MB) | FEMA Flood Zone Change Map, City of Coos Bay, Coos County, Oregon | 1:12,000 |
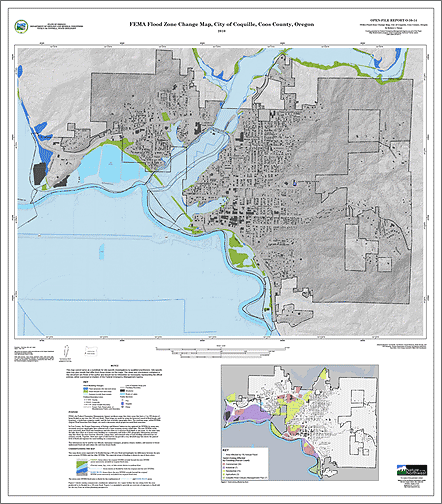
| Open-File Report O-10-14 (6 MB) | FEMA Flood Zone Change Map, City of Coquille, Coos County, Oregon | 1:6,000 |
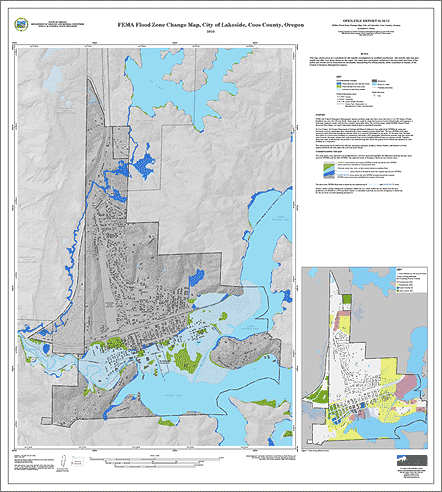
| Open-File Report O-10-15 (6 MB) | FEMA Flood Zone Change Map, City of Lakeside, Coos County, Oregon | 1:6,000 |
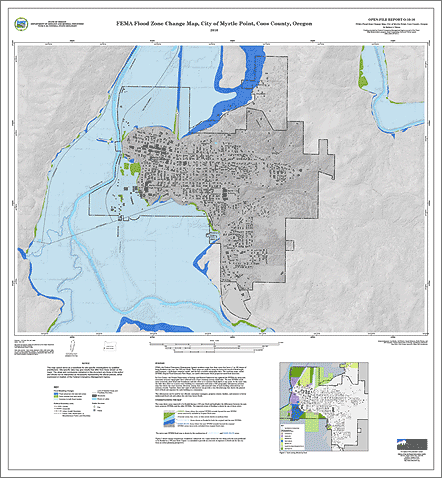
| Open-File Report O-10-16 (5 MB) | FEMA Flood Zone Change Map, City of Myrtle Point, Coos County, Oregon | 1:6,000 |
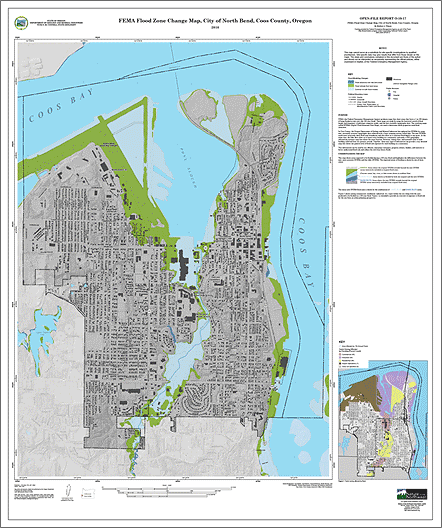
| Open-File Report O-10-17 (6 MB) | FEMA Flood Zone Change Map, City of North Bend, Coos County, Oregon | 1:6,000 |
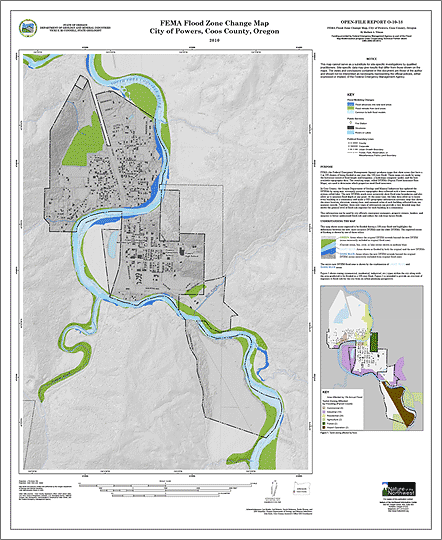
| Open-File Report O-10-18 (4 MB) | FEMA Flood Zone Change Map, City of Powers, Coos County, Oregon | 1:6,000 |
Each publication includes:
Also see companion publications One-Percent Annual Flood Hazard and Exposure Risk Maps, Coos County, Oregon and the Oregon HazVu Web Tool.
O-10-12, Bandon, actual size 36 x 52 inches:
O-10-13, Coos Bay, actual size 48 x 36 inches:
O-10-14, Coquille, actual size 36 x 41 inches:
O-10-15, Lakeside, actual size 36 x 40 inches:
O-10-16, Myrtle Point, actual size 36 x 39 inches:
O-10-17, North Bend, actual size 36 x 43 inches:
O-10-18, Powers, actual size 27 x 33 inches: