DOGAMI Interpretive Map Series
[Go back] | Publications Center | DOGAMI Home
Publication Preview
 IMS-58, Natural hazard risk report for Tillamook County, Oregon, including the cities of Bay City, Garibaldi, Manzanita, Nehalem, Rockaway Beach, Tillamook, and Wheeler and the unincorporated communities of Neskowin, Oceanside, Netarts, and Pacific City, by Matt C. Williams, Christina Appleby, John Bauer, and Jed Roberts
What's in this report?
This report describes the methods and results of natural hazard risk assessments for Tillamook County communities. The risk assessments can help communities better plan for disaster.
Report downloads:
IMS-58 EXECUTIVE SUMMARY
This report was prepared for the communities of Tillamook County, Oregon, with funding provided by the Federal Emergency Management Agency (FEMA). It describes the methods and results of the natural hazard risk assessments performed in 2016 by the Oregon Department of Geology and Mineral Industries (DOGAMI) within the study area. The purpose of this project is to provide communities within the study area a detailed risk assessment of the natural hazards that affect them to enable them to compare hazards and act to reduce their risk. The risk assessments contained in this project quantify the impacts of natural hazards to these communities and enhances the decision-making process in planning for disaster.
We arrived at our findings and conclusions by completing three main tasks: compiling an asset database, identifying and using best available hazard data, and performing natural hazard risk assessment.
In the first task, we created a comprehensive asset database for the entire study area by synthesizing assessor data, U.S. Census information, Hazus-MH general building stock information, and building footprint data. This work resulted in a single dataset of building points and their associated building characteristics. With these data we were able to represent accurate spatial location and vulnerability on a building-by-building basis.
The second task was to identify and use the most current and appropriate hazard datasets for the study area. Most of the hazard datasets used in this report were created by DOGAMI and some were produced using high-resolution lidar topographic data. While not all the data sources used in the report are countywide, each hazard dataset were the best available at the time of writing.
In the third task, we performed risk assessments using Esri® ArcGIS Desktop® software. We performed two risk assessment approaches: (1) estimated loss (in dollars) to buildings from flood (recurrence intervals) and earthquake scenarios using FEMA Hazus®-MH methodology, and (2) calculated number of buildings, their value, and associated populations exposed to earthquake, flood, and tsunami inundation scenarios, or susceptible to varying levels of hazard from landslides, coastal erosion, and wildfire.
The findings and conclusions of this report show the potential impacts of hazards in communities within Tillamook County. A Cascadia Subduction Zone (CSZ) event (earthquake and tsunami) will cause extensive damage and losses throughout the county. We ran Hazus-MH earthquake simulations to illustrate the potential reduction in earthquake damage through seismic retrofits. Flooding can be a recurrent problem for many communities in the study area and we quantify the number of elevated structures that are less vulnerable to flood hazard. Our analysis show that new landslide mapping based on improved methods and lidar information will increase the accuracy of future risk assessments. The risk from coastal erosion is higher for the communities of Neskowin and Rockaway Beach than others part of Tillamook County. During the time of writing, the best available data show that wildfire risk is moderate for the overall study area. Our findings also indicate that most of the study area’s critical facilities are at high risk to a CSZ event (earthquake and tsunami). We also found that the two biggest causes of population displacement are a CSZ event (earthquake and tsunami) and landslide hazard. Lastly, we demonstrate that this risk assessment can be a valuable tool to local decision-makers.
Results were broken out for the following geographic areas:
- Unincorporated Tillamook County (rural)
- Communities of Oceanside and Netarts
- City of Bay City
- City of Manzanita
- City of Rockaway Beach
- City of Wheeler
- Community of Neskowin
- Community of Pacific City
- City of Garibaldi
- City of Nehalem
- City of Tillamook
Selected Countywide Results
Total buildings: 27,371
Total estimated building value: $2.8 billion
|
Cascadia Subduction Zone
Magnitude 9.0 Earthquakea
Red-tagged buildingsb: 7,812
Yellow-tagged buildingsc: 1,856
Loss estimate: $821 million |
Cascadia Subduction Zone
Tsunami Inundation
Number of buildings exposed: 5,167
Exposed building value: $561 million |
100-year Flood Scenario
Number of buildings damaged: 1,999
Loss estimate: $26 million |
Landslide Exposure (High and Very High Susceptibility)
Number of buildings exposed: 7,906
Exposed building value: $779 million |
Coastal Erosion Exposure (Moderate Hazard)
Number of buildings exposed: 609
Exposed building value: $117 million |
Wildfire Exposure (High Risk)
Number of buildings exposed: 565
Exposed building value: $48 million |
aResults reflect damages caused by earthquake to buildings outside of the tsunami zone. Earthquake and tsunami results combined estimate the total damages from a CSZ event.
bRed-tagged buildings are considered to be uninhabitable due to complete damage.
cYellow-tagged buildings are considered to be of limited habitability due to extensive damage. |
GEOGRAPHIC INFORMATION SYSTEM (GIS) DATA
Geodatabase is Esri® version 10.2 format.
Metadata is embedded in the geodatabase and is also provided as separate .xml formatted files.
The GIS data included with this publication are in an ArcGIS version 10.1 file geodatabase.
| Tillamook_County_Risk_Report_Data.gdb: |
| Feature dataset: Asset_Data: |
|
|
| BF (Building footprints) |
polygons |
.xml |
| Communities |
polygons |
.xml |
| UDF |
points |
.xml |
| Raster data: Hazard Data: |
|
|
| Fl_depth_10yr.xml |
grid |
.xml |
| Fl_depth_50yr.xml |
grid |
.xml |
| Fl_depth_100yr.xml |
grid |
.xml |
| Fl_depth_500yr.xml |
grid |
.xml |
APPENDIX E: MAP PLATES (PDFs, 17 x 11 inches each)
Plate 1. Building Distribution Map of Tillamook County, Oregon (7MB PDF)
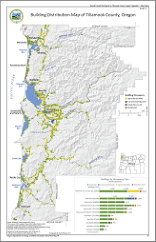
Plate 2. Population Density Map of Tillamook County, Oregon (5 MB PDF)
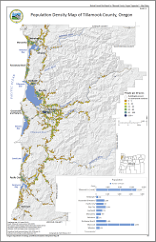
Plate 3. CSZ M9.0 Peak Ground Acceleration Map of Tillamook County, Oregon (8 MB PDF)
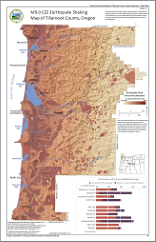
Plate 4. Tsunami Inundation Map of Tillamook County, Oregon (7 MB PDF)
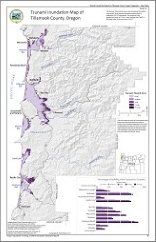
Plate 5. Flood Hazard Map of Tillamook County, Oregon (5 MB PDF)
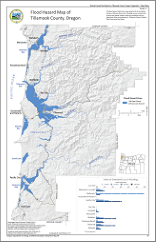
Plate 6. Landslide Susceptibility Map of Tillamook County, Oregon (7 MB PDF)
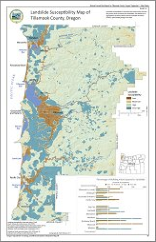
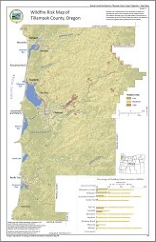
Plate 7. Wildfire Risk Map of Tillamook County, Oregon (8 MB PDF)